
Compare lineup rotations, sideout patterns, and rally outcomes across match states.
Volleyball analytics
Volleyball
For two years, BSA has partnered with UCLA men's and women's volleyball on work that supports coaching decisions with clearer, faster information.

Beck Zimmerman
Volleyball Chair
Stats & Data Science · 2027
Workstreams
What this team studies
Identify serve-receive pressure points and target tendencies for match preparation.
Track how first contact, transition choices, and attack quality shape point outcomes.
Featured work
Volleymetrics Spring 2026
An advanced volleyball analytics pipeline and R Shiny dashboard built with UCLA Athletics, turning DataVolley scouting files into custom reception, offense, serving, blocking, and clutch-performance metrics.
Problem
UCLA Volleyball needed a reusable way to turn raw DataVolley scouting files into coaching-ready metrics across serve receive, attack quality, serve pressure, blocking influence, and late-set performance.
Approach
The team built an R pipeline that batch-loads DataVolley files with datavolley, combines roughly 100 matches into a season-long play-by-play table, derives custom metrics like SPI, SEI, OSS, BIS, passer rating, and clutch leaderboards, and surfaces results in a multi-tab Shiny dashboard.
Result
Open project The dashboard gives analysts and coaches sortable leaderboards, team reports, and ggplot2 visualizations for serve zones, serve types, blocking trends, setter-hitter efficiency, and pressure-situation performance.
Active projects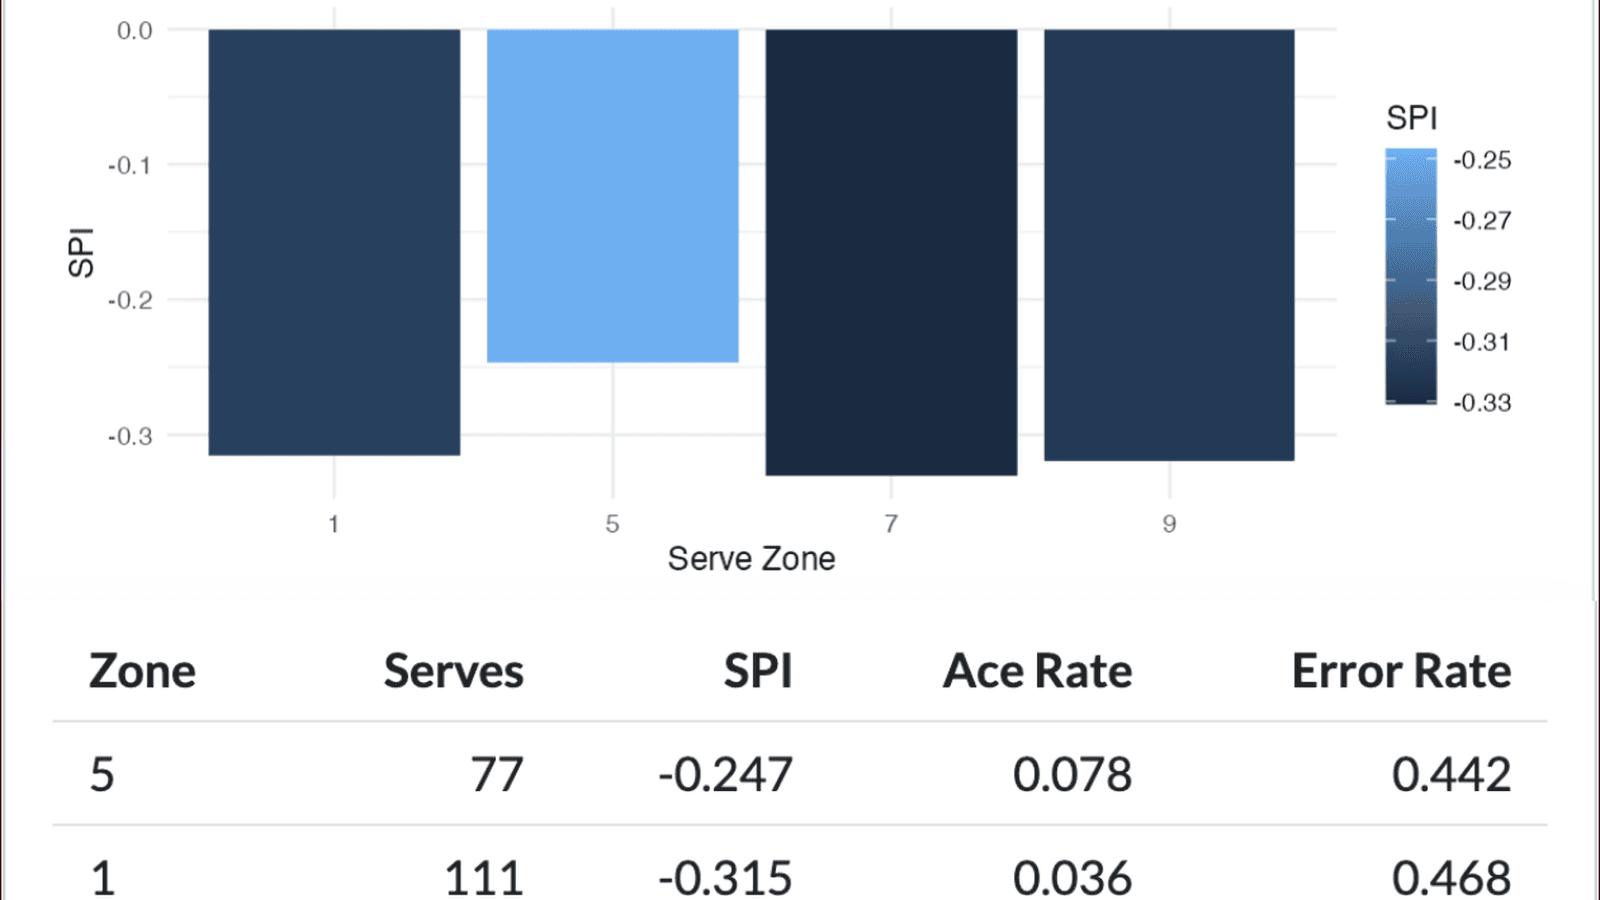
Current work
Volleymetrics Spring 2026
September 7, 2026Volleyball · 2025-26
An advanced volleyball analytics pipeline and R Shiny dashboard built with UCLA Athletics, turning DataVolley scouting files into custom reception, offense, serving, blocking, and clutch-performance metrics.
RShinydatavolley
Tool