Sports Illustrated
In Major League Baseball (MLB), a reliever is defined as any pitcher who is substituted for a starting pitcher to help finish a game. Ideally, even as of a few years ago, relievers were meant to be brought in after the starter had pitched at least 6 or more innings. However, as the game has evolved, relievers have expanded their respective roles. For instance, teams like the Tampa Bay Rays have implemented relievers in a starting role, where the relievers are known as "openers." Starters, who used to go much deeper in the game, are being pulled in the 5th inning--sometimes earlier--more often than ever. After all, starters are limited to a certain number of pitches, meaning that you'll rarely see pitchers venture into triple-digit pitch counts to prevent injuries that may require Tommy John surgery. Consequently, relievers are being used more often and for longer periods of time. But, the volatility amongst MLB relievers hasn't gone away, which means consistency might be hard to find in a reliever. This variability brings about an important question for MLB front offices: is it worth paying extra for free agent relievers in today's game? Through an examination of past and present player salaries and performance, I will try to see whether inflated salaries for relievers are really worth it.
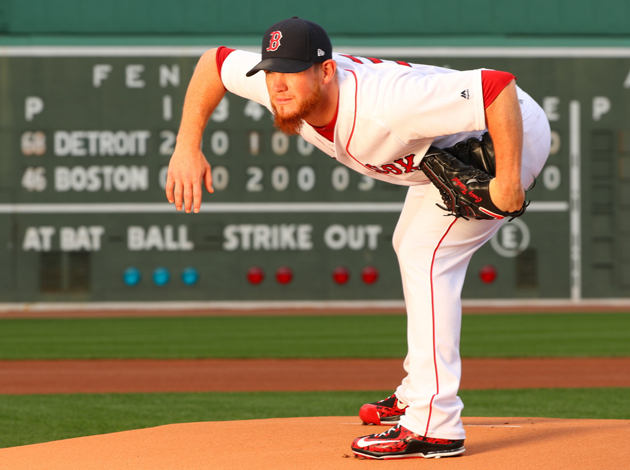
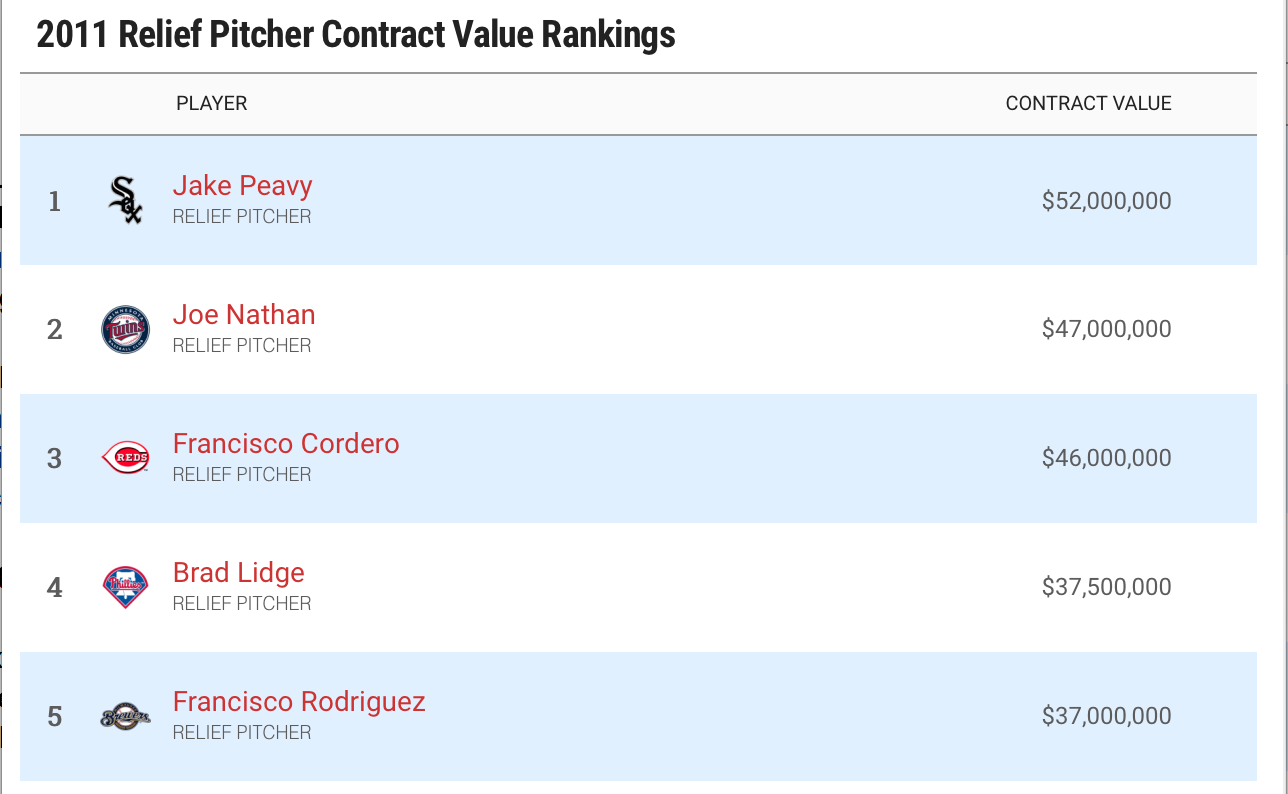
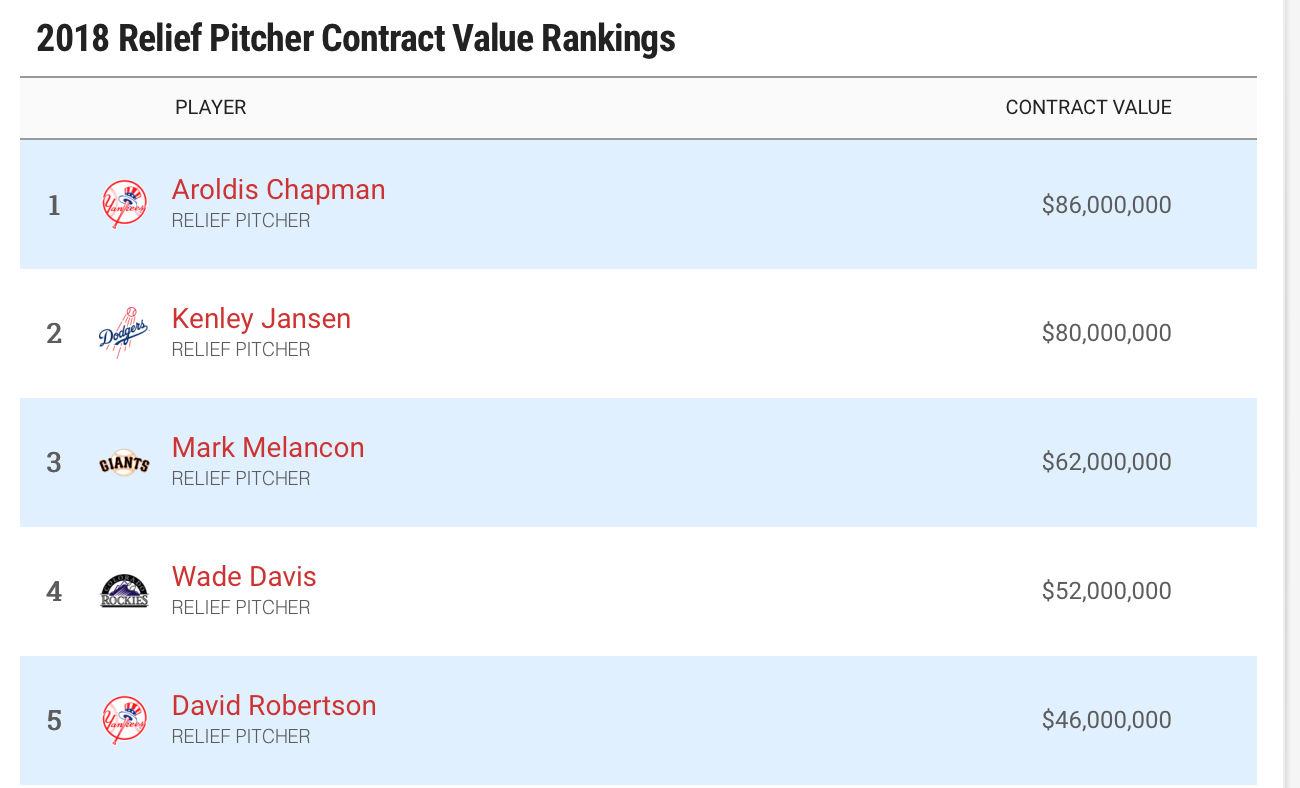
To put it frankly, relievers are receiving all-time high salaries. Front offices are willing to spend top dollar on the best arms available, even if this strategy might be a risky proposition. One good example is how the Colorado Rockies spent over $100 million on just their relievers over the 2018 offseason. That was more than twice the amount they spent on starters! In fact, the Rockies were 1 of 7 MLB franchises to commit more money to their bullpen than their starting pitchers this past offseason. To further demonstrate the increasing value of relievers, I looked at top reliever salaries from the 2011 and 2018 MLB seasons on Spotrac.com.
Here, we see that the top relievers of 2018 received much more money than their counterparts from 2011. For instance, Aroldis Chapman and Kenley Jansen both earned upwards of $80 million contracts in 2018, while the top breadwinner from 2011, Jake Peavy, earned a mere $52 million contract, even though he also started a fair share of games. Moreover, David Robertson, who earned the 5th-most money of 2018 relievers, equaled the earnings of the 3rd highest-paid 2011 reliever, Francisco Cordero. And if we take into account the context of some of these contracts, the results might even be more revealing. After all, David Robertson isn't even an elite reliever on his own team, as the Yankees arguably have better relievers in Aroldis Chapman, Dellin Betances, and Chad Green, among others. On the other hand, all five names listed from the 2011 season were all top dogs in their respective bullpens. This example gives average fans a better idea of just how drastically reliever salaries have shifted upwards over the past few years.
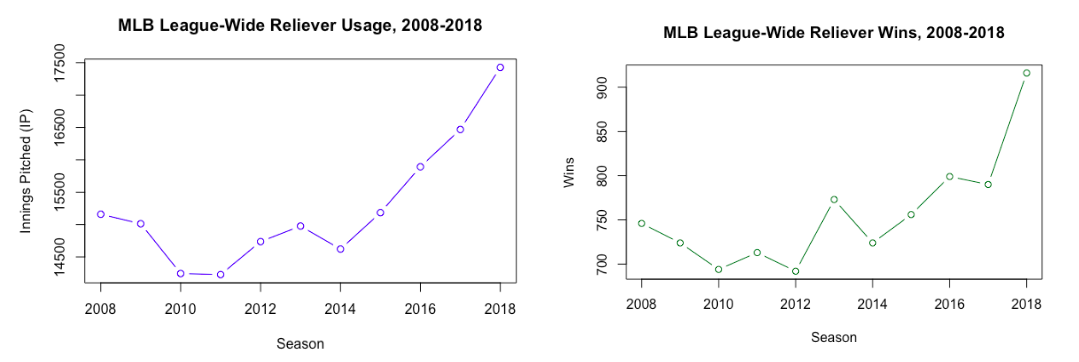
One way to account for the spike in reliever salaries has been their increased usage in games throughout the league. Based on data from fangraphs.com, I created visualizations of total reliever innings pitched and wins from the years 2008-2018 to demonstrate the uptick in reliever usage recently.
Back in 2008, relievers completed just over 15,000 cumulative innings, which was still a lot for that era in baseball. Just look at the 2009 to 2014 seasons, where the cumulative innings pitched by relievers didn't even match the 2008 campaign. However, the most recent four seasons all had dramatic upticks in innings pitched for relievers league-wide. As a result, in the 2018 season, relievers nearly posted a whopping 17,500 innings, which is over 2,000 innings more than in 2008. Correspondingly, we saw many of the same trends with reliever wins. First of all, there was a bit of a lull in wins earned from 2008 all the way up to 2014. However, from 2015 to 2018, there has been a gradual increase in reliever wins. In fact, the ascent from 2017 to 2018 is extremely relevant; after a slight dip from 2016 to 2017, the 2018 season had over 100 more reliever wins than the previous campaign.
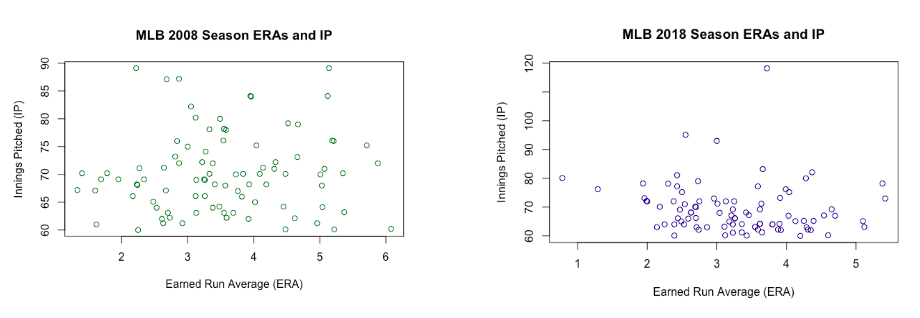
Even though reliever usage has deHnitely increased in recent times, relievers are still extremely volatile. To examine this assumption, I took a look at the 2008 and 2018 seasons for reliever data on fangraphs.com; speciHcally, I examined earned run averages (ERAs), which are a measure of how effective a pitcher is during his time in games. Since the goal of a pitcher is to allow as few runs as possible, low ERAs are indicative of good pitching. High ERAs, on the other hand, show that the pitcher is rather ineffective.
To make these scatterplots, I first filtered each season's set of relievers by only including those who have pitched at least 60 innings. This still gives a relatively large pool of relievers, but it doesn't have an excessive amount of guys. Then, I plotted with the x-axis being ERA and the y-axis being IP to find the spreads of ERAs and correlations between ERA and IP for both seasons. For the 2008 season, there were 92 qualifying relievers with 60+IP, yet none of them exceeded 90 IP. The ERAs ranged from 1.33 all the way up to 6.08, but the median ERA was 3.515. The standard deviation of the 2008 ERAs was 1.09, which is pretty high given the relatively low median ERA. As for the correlation coefficient between IP and ERA for the 2008 season, it was a mere 0.07, which demonstrates a very weak correlation between the two variables. Therefore, just because a reliever pitched more innings did not mean that he would be more effective in terms of ERA for the 2008 season. As for the 2018 season, there were 89 qualifying relievers with 60+IP, but unlike in 2008, there were three relievers that exceeded 90 innings pitched. The ERAs also had a similarly wide range to the 2008 season, going from a low of 0.78 to a high of 5.42, while the median was a pedestrian 3.23. So, the ERAs for 2018 relievers are slightly lower than those for 2008 relievers, but the ranges are very comparable. The ERAs of 2018 relievers varied with a standard deviation of 0.90, which suggests that the variability of performance amongst relievers has somewhat declined since 2008, but one would question whether this is enough of a dip in the standard deviation of ERAs to forecast a further decrease in reliever volatility. With respect to the correlation coefficient between the 2018 ERAs and IP, it was -0.14, which again suggests a fairly weak correlation between the two variables. Clearly, reliever performance has a similar level of variability in the 2018 season when compared to relievers from the 2008 season.
Overall, through an examination of reliever data from recent MLB seasons, we saw that although there has been an appreciable increase in both reliever pay and usage on the diamond, there was still too much variability among ERAs and not enough correlation between usage and effectiveness to suggest that relievers should be paid any more than they currently are being paid. No doubt, relievers are changing the game by taking the weight off starters and even opening games at times; this theory would have been shot down even a few years ago, and there are still a fair share of critics who ascribe to old-fashioned baseball and an aberration for all things analytics. And even though ERAs and standard deviations of ERAs have technically lowered since 2008, the variability from reliever to reliever is still too noticeable for front offices to be handing out such large sums of money to middle-of-the-road bullpen guys. Personally, I'd like to see how relievers do over the next few years before making any snap decisions about whether or not they are as effective as some MLB executives believe. Only time will tell if these relievers are worth all the hype.